Crypto markets produce an enormous amount of noise. Prices move on tweets, regulatory rumours, liquidation cascades, and macro sentiment shifts that have nothing to do with any individual asset’s fundamentals. For a new trader trying to make sense of it all, the volume of information is paralyzing.
Technical analysis cuts through that noise by focusing on one thing: price. Not what a project should be worth, not what a founder said in an interview, not what the on-chain metrics suggest about long-term value. Just what price has done and what it is doing now, expressed through charts, patterns, and a handful of well-tested tools.
The underlying logic rests on three principles that Charles Dow first articulated in the 1800s and that remain as applicable to Bitcoin as they were to railroad stocks. Price reflects everything the market knows. Price moves in trends that persist until something breaks them. And market behaviour repeats, because human psychology repeats.
What Technical Analysis Actually Does
Technical analysis does not predict the future. This is the most important thing for any beginner to understand before spending an hour on a chart. What it does is identify conditions where certain outcomes are more probable than others, based on how similar setups have resolved historically.
A support level does not guarantee that price will bounce. It identifies a zone where buyers have historically been willing to step in, making a bounce more likely than it would be at a random price level. A trend line does not mean price will continue in that direction forever. It shows the current trajectory and gives you a framework for recognising when that trajectory changes.
The practical value of technical analysis is that it gives you a decision-making structure. Without it, trading is reactive – you are guessing. With it, you have defined levels where you consider entering, defined conditions that invalidate your thesis, and a framework for managing risk before a trade opens rather than improvising after it goes against you.
The Three Tools Every Beginner Needs First
The crypto market supports dozens of indicators and hundreds of chart patterns. Most of them are derived from a handful of foundational concepts. Beginners who master these foundations will find every advanced tool easier to understand, because they are all variations on the same themes.
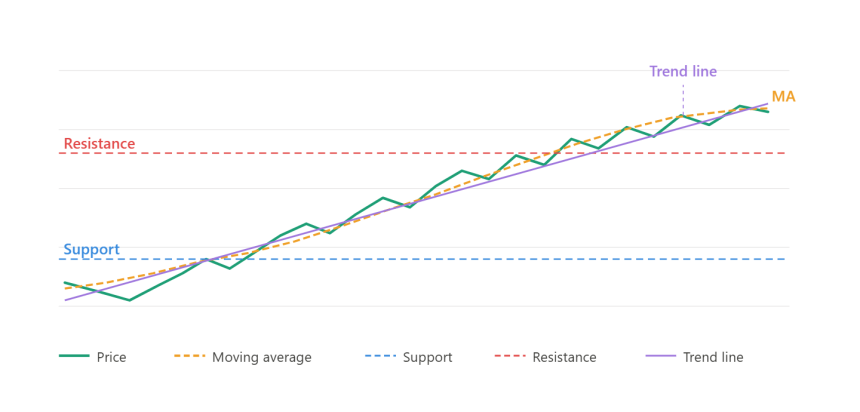
Trend lines and market structure are the starting point. A trend line connects successive lows in an uptrend or successive highs in a downtrend, showing the direction and angle of the current move. Market structure – the sequence of higher highs and higher lows in an uptrend, lower highs and lower lows in a downtrend – tells you whether you are in a trending environment at all. Before applying any other tool, establish whether the market is trending or ranging. This single question determines which strategies are appropriate.
Support and resistance levels are the horizontal lines that most traders draw first. Support is a price zone where demand has historically exceeded supply – where buyers have stepped in and stopped price from falling further. Resistance is the opposite. These levels form at previous swing highs and lows, round numbers, and prior consolidation zones. Their power comes from memory: other traders remember these levels and place orders there, creating self-fulfilling concentration of activity.
Moving averages smooth price data over a defined period, filtering out noise and making the trend direction visually clearer. The 20-period moving average tracks short-term momentum. The 50-period captures intermediate trend. The 200-period is the long-term benchmark – crypto assets trading above their 200-day MA are broadly considered in healthy uptrend territory, below it in bearish territory. Moving averages also act as dynamic support and resistance, with price frequently finding support at the 50 MA during pullbacks in a strong uptrend.
The diagram below shows how these three tools appear on a typical price chart.

How These Tools Work Together
The tools above are most powerful when they confirm each other rather than being read in isolation. A price pullback to a support level is a setup. A pullback to a support level that also coincides with the 50-period moving average and a diagonal trend line is a higher-conviction setup because three independent frameworks are pointing at the same zone.
This principle – confluence – is the foundation of most serious technical trading approaches. You are not looking for one signal; you are looking for multiple signals that agree. When they do, the probability of the setup working out improves, even though no setup is ever guaranteed.
The table below shows how beginners can combine these tools into a basic trading framework:
| Tool | What it identifies | How to combine |
| Market structure | Trend direction and phase | Sets the bias – only trade long in an uptrend |
| Trend line | Trajectory and momentum | Entry zone when the price pulls back to the line |
| Support level | Demand zone | Strengthens entry if support = trend line |
| Moving average | Dynamic trend confirmation | Extra confluence if MA aligns with support |
| Resistance level | Profit target zone | Take partial profits as the price approaches |
What to Avoid as a Beginner
Two mistakes dominate beginner technical analysis failures in crypto, and both are worth naming directly.
The first is indicator overload. A chart with six indicators running simultaneously – RSI, MACD, Bollinger Bands, Stochastic, two moving averages, and a volume profile – produces information paralysis rather than clarity. Most of these indicators are mathematically derived from price, which means they largely tell you the same thing in different formats. Start with price structure and one or two supporting tools. Add complexity only when you understand what each addition contributes that the others don’t.
The second is ignoring the timeframe hierarchy. A bullish reversal signal on a 5-minute chart means almost nothing if the daily chart shows a clear downtrend. Technical analysis is not timeframe-specific – it applies at every level – but the higher timeframe always has more weight. A signal that aligns with the daily trend is significantly more reliable than one that fights it.
For those who want to develop this foundation further, a comprehensive breakdown of technical analysis for traders covers the full range of tools including chart patterns, volume analysis, and the major indicator families.
Conclusion
Technical analysis gives crypto traders a structured approach to a market that can feel chaotic. Price, trend, support, resistance, and moving averages – these five concepts alone, applied consistently with proper risk management, are sufficient to build a functioning trading approach. They are not sufficient to guarantee profits, but nothing is. What they provide is a decision-making framework that replaces guessing with probability-based reasoning.
The learning curve is real but manageable. Start with market structure on the daily chart. Learn to identify support and resistance. Add a single moving average. Practice reading these three tools together on historical charts before applying them to live markets. The traders who develop genuine skill with the basics consistently outperform those who chase complexity before they have mastered the fundamentals.
WATCH TOP VIDEOS FROM NIGERIAN TRIBUNE TV
- Relationship Hangout: Public vs Private Proposals – Which Truly Wins in Love?
- “No” Is a Complete Sentence: Why You Should Stop Feeling Guilty
- Relationship Hangout: Friendship Talk 2025 – How to Be a Good Friend & Big Questions on Friendship
- Police Overpower Armed Robbers in Ibadan After Fierce Struggle