 Chief Obafemi Awolowo’s insightful book about Nigeria’s political and economic survival The Strategy and Tactics of The People’s Republic of Nigeria, which was first published in 1970.
Continued from last week

Section III — Goals set for the Educational Structure
Two educational goals have been set for achievement within the 20- year educational plan period.’ The first target is that the percentage distribution of school population should reach 78.68%, 20.17%, and 1.15 %, in the first, second and third levels, respectively. It is assumed that this first target would be achieved by 1984. When this has been attained, some further marginal increases in the second and third levels should be aimed at within a short time thereafter, Thus a second target of 76.25%, 22.37%, and 1.38% in the distribution of school population, is set for 1988.
Checks The table below shows the corresponding distribution in other parts of the world.

(b) U.K. Experience: 3rd Level Distribution of Full-Time Students

Note;
(i) The lower rate in ‘Further Education’ is a reflection of the large number of part-time trainees in this category. This fact notwithstanding, the relative position of ‘Further Education’ has improved considerably over the years due to increasing technological advancement.
(ii) Part of the large increase in Teacher Training between 1954/55 and 1962/63 was due to the lengthening of the Training College Course in England & Wales.
Rates Chosen;
The following distribution rates have been chosen:
University 62.5;
Teacher’s College 22.5;
Technical College 15
These rates are arrived at by approximating our requirements to that of Britain in 1954/55, but assuming a higher rate than the British one for ‘further education’ (technical college), in view of the increasing importance being attached to technology throughout the world.
The large university proportion is justified by the fact that universities provide teachers for both secondary and third levels of education and also for research. Moreover, an increasing number of technical and professional courses are now being pursued in universities as degree courses; for example, the new honours degree course in chemical technology at the University of He. This same pattern is also observed in other countries, like Britain.
Section IV -Costs
- Primary Education- Recurrent Cost
(1) Callaway and Musone in Financing of Education in Nigeria estimated the unit cost per pupil in primary schools as £5.73 in the West and £9.86 in Lagos in 1962. They further estimated that teachers’ salaries constituted 80.6% and 95% of total recurrent expenditure* in Lagos and rural areas respectively. It would be reasonable to assume an overall rate of 90%. (2) Some 10 schools are considered in the Western State. Data as at 31st March, 1968 show, (See overleaf).
(i) Cost per pupil of teachers’ salaries ranges between £6.66 and £9.26;
(ii) The cost is least in rural areas and highest in urban centres;
(iii) Schools with the highest number of Grade II teachers and therefore highest salary bills have the highest costs;
(iv) A low pupil/teacher ratio works towards increasing unit costs.
Further, the pupil/teacher ratio tends to be higher in urban than in the rural areas.
(3) Cost per pupil of teachers’ salaries is bound to increase when the existing Grade III teachers are further trained to Grade II level, and when more Grade I teachers teach in primary schools. Optimal attainment of the pupil/ teacher ratio is however expected to dampen this upward trend in salary /pupil cost.
The over-all effect is expected to make the salary/pupil cost about £10. It as estimated earlier,. teachers’ salaries constitute about 90% of total recurrent cost the recurrent cost/pupil would be £ll.
In the meantime however, that is, before the educational quality of teachers is improved, the recurrent cost per pupil should be £10.
It should gradually increase to £ 11 by 1984.
- Primary Education – Capital Cost
(i)) The E.C.A. estimated the cost of primary school building per classroom of 50 pupils as £500. On this basis, we estimate the cost per classroom of 35 pupils as £350.
(ii) Callaway and Musone estimated similar cost in Nigeria for the year 1962 as follows:
Region Cost per Class-room Region Cost per Class-room
Northern 550 Eastern 200
Western 250 Lagos 1,700
(iii) A cost of £300 per class-room is assumed reasonable.
- Secondary Education – Recurrent Cost
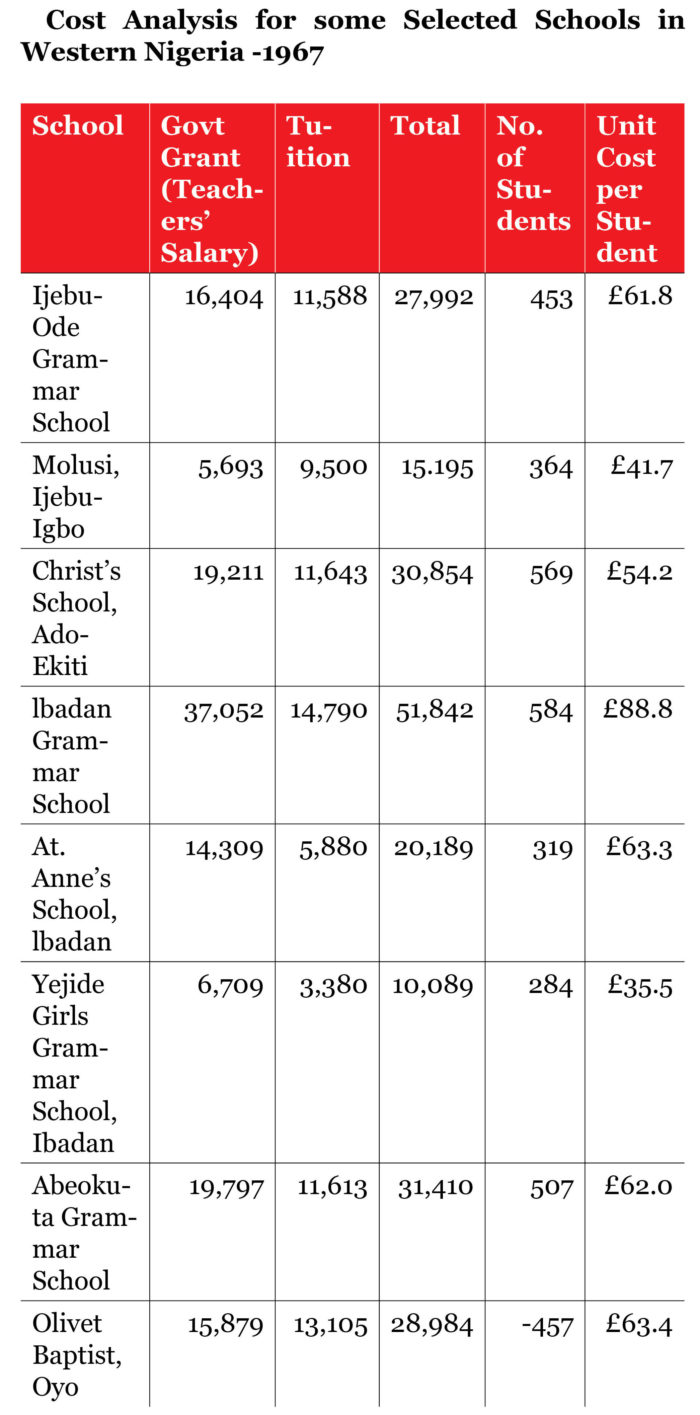
The policy implication of free tuition in secondary schools is that the government would continue to pay the existing grants plus the tuition fees of children. The existing grants are made up of the teachers’ salary bill plus £5 per pupil in Class I-V or (VI) and £6 per pupil in H.5.C. classes. The table below shows that the unit cost per pupil varies from £35’5 to £88.8 in respect of some schools in Western Nigeria in 1966. In view of the fact that tuition fees are uniform in all schools in the State, the main factor responsible for the large variation is the teachers’ salary bill. It is higher in schools with higher qualified and more experienced teachers than in schools with less qualified and less experienced ones.
In view of the above, it is reasonable to assume the unit cost per pupil of £65 p.a. in 1970, thence gradually rising to £70 p.a. in 1984.
To be continued